Static Code Analysis and Linting
In this course unit you'll learn about the interest of using static code analyzers, the technical components they internally rely on, and how you can effectively use static code analysis in your project to improve code quality.
Lecture upshot
Static code analysis provides additional code quality standards that cannot be obtained with classic testing
About code analysis
Code analysis is the process of examining source code to identify issues and improve software quality. You’ve already seen two code analysis techniques: Debugging and Unit testing
- Debugging is a way to analyze code step by step, by examining variable values throughout execution.
- Unit testing is the automated verification of a specific function's behaviour, by asserting outputs for given inputs.
Both require code execution. They are dynamic code analysis techniques.
Could there be a downside to dynamic code analysis ?
Code execution can slow code analysis significantly down, especially if the analysis requires human interaction, as it is the case with debugging.
General limitations
No matter the technique, software analysis is not trivial, and mistakes during diagnosis can happen:
For a given bug or report, we can distinguish between four diagnostic categories:
- True positive : A certain bug was reported, and it actually is a bug.
- False positive : A certain bug was reported, but it is actually not a bug.
- False negative: A certain bug exists, but was not reported.
- True negative : A certain bug does not exist, and neither was it reported.
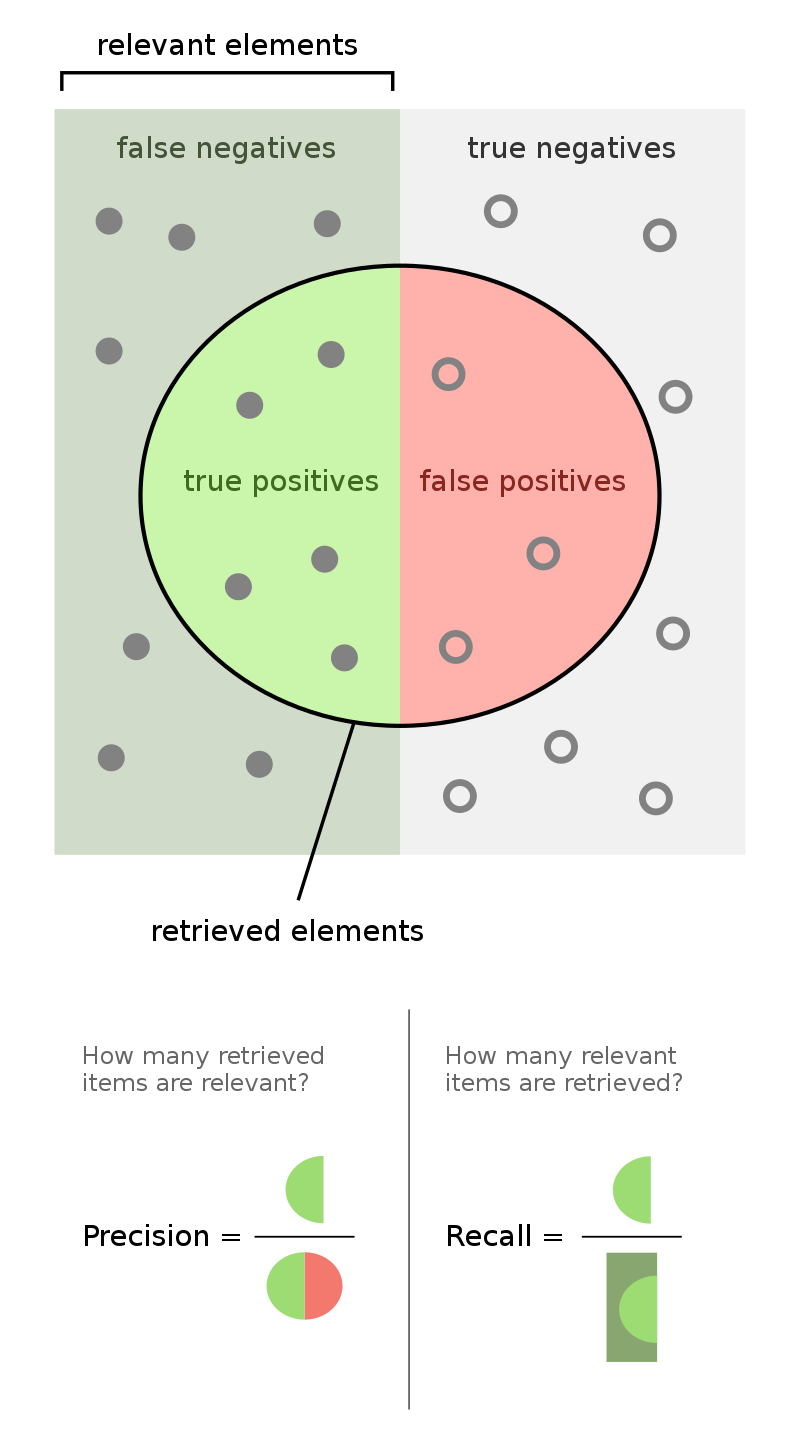
Source: Wikipedia - Precision and Recall
Limitations with dynamic code analysis
- Program execution (dynamic analysis) can only give insight on behavioural characteristics.
- However, there are other quality metrics
- Code formatting
- Documentation
- Code simplicity
Testing
Tests are essential for quality software, development. However...
Can tests prove program correctness ?
Unfortunately not, no. Tests can only find bugs, but cannot prove their absence. Programs can be very well tested and still have bugs.
Debugging
Debugging provides huge insight on arbitrary program state. But as a manual approach it is most time consuming and ideally must be repeated whenever the code evolves.
Static code analysis
- Static code analysis is analyzing code, without executing the program.
- That is, we inspect the code directly, without testing how it behaves.
- In principle, the most primitive for of static code analysis is: "Reading the sourcecode and thinking about possible bugs."
Unfortunately...
"All non-trivial semantic properties of programs are undecidable. --Rice 1951"
What does this mean in practice ?
It is not possible to have a sound and complete program analysis. You'll always have false positives or false negatives. Best you can achieve is an approximation.
- Complete: At least we've found all the bugs (and reported some false positives)
- Sound: The bugs found are all truly bugs (but we might have some false negatives)
Static code analysis basics
- Common to all forms of static code analysis is parsing of code, to reason about it's structure without execution.
- Parsing is also the first step of every compiler: Trying to understand the code structure, by breaking the program into "atomic blocks".
Parsing consists actually of two components:
Lexer
Lexer (also called scanner or tokenizer): Iterate over code and identify the appropriate token for every element. For example using JLex
The lexer takes as input pure source code:

- Depending on the programming language used, different tokens are defined.
- For java there are only 6 token types:
| Token | Example |
|---|---|
| Keyword | abstract, boolean, byte, ... |
| Identifier | variable names, function names, ... |
| Literal | concrete values, e.g. 42 |
| Operator | <, >, =, +, ... |
| Separator | ;, [,],{,}`, ... |
| Comment | //, /* ... */, /** ... */ |
See also the token reference chart...
Can you identify the tokens ? (Expand to verify your solution)

You can inspect the AST of java code, using the JDT AstView plugin.
Parser
The Parser runs over the tokenized program and builds an abstract syntax tree (AST).
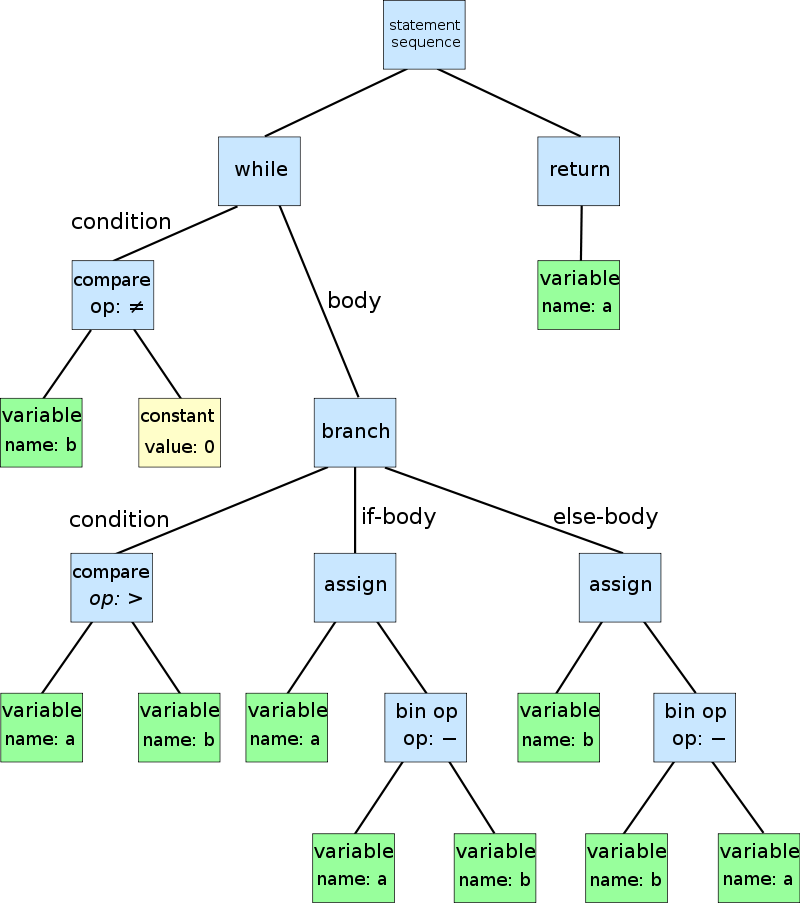
Image credits: https://en.wikipedia.org/wiki/Abstract_syntax_tree
Now what's an AST ?
- Tree data structure
- Every node stores abstract information, e.g. the token type
- Represents program structure
Why would I want an AST ?
- The AST allows for optimizations, e.g.:
- removing unreachable (dead) code.
- constant folding: evaluating constant expressions at compile time.
- The AST tells a lot about semantic validity. If the AST exists, it means the code respects the language's grammar.
- The AST can be used for reasoning, e.g. finding duplicated code (Common Subexpression Elimination)
The AST is useful, but not strictly necessary...
Static code analysis, as well as compiling does not necessarily need an AST. While the AST is highly useful, languages can be analyzied direclty after tokenization. Likewise, compilers do not necessarily need an AST. If no optimzations are needed, a compiler can directly translate code from the tokenized sources. Primitive compilers, not using an AST, are also called single-pass compilers."
Most static code analysis techniques (and for sure the more powerful ones) use an AST.
Analysis techniques overview
The most important techniques for static code analysis are:
- Linting (grep): Search the AST for specific patterns or anti-patterns (e.g. missing separator/punctuator)
- Example: ast-grep
- Side note:
grep(the unix command) stands for "Global Regular Expression Print".ast-greplike the unix command uses regular expressions to search (and find) structures. The difference is that unixgrepoperates on text files andast-grepdirectly operates on the abstract syntax tree of a program. They are the same technique, applied on different contexts.
- Dataflow analysis: Analyze where in program variables are defined and used. Operates on AST, can also be used for AST optimization.
- Symbolic execution: Figure out which inputs cause each part of program to execute. Execute the program without " actual values", try to find pathological inputs and dead code.
- Model checking: Verify AST model and try to exclude safety risks, e.g. crash.
- Formal verification: Using formal methods of mathematics to prove software correctness.
Static != Automated
While all of the above are static analysis techniques, there is also a range from manual to automated verification. Just because analysis uses static code, does not mean the analysis it is all automated !
In context with dynamic techniques
Taking into account static vs dynamic, and manual vs automatic, we can categorize analysis techniques:

Security experts use hybrid techniques
Hybrids are possible. Recent research e.g. combines computation intense Symbolic Execution with Fuzzing techniques. The program is first analyzed with static code analysis techniques, once a set of likely-pathological inputs is found, we switch to Fuzzing and bombard the program at runtime with input mutations, to see what happens. This technique revealed severe security bugs that gone unnoticed in public software for years. See Driller
For the remainder of the course we are not too interested in how exactly analysis tools work internally. If you're interested in the details, there's a great course about Program Security: INF889 (with Quentin)
Code analysis tools
We don't just want techniques that in theory help improving code quality. We want tools that reliably ensure our code gets better. The must be actionable and automated.
- Actionable: The tool's quality checks are conveniently accessible, ideally from the IDE.
- Automated: The tool's quality checks are systematically invoked and reject bad code, ideally as part of the build
process.
- Rejected from execution: The tool does not allow us to run low-quality code.
- Rejected from spreading: The tool does not allow us to share low-quality code via git.
In the remainder of this lecture we'll cover a a few essential code analysis tools and how they're used.
IDE syntax highlighting
IDEs provide syntax highlighting. Basic text editors usually don't.
- In the first lab you were coding in a basic text editor, without syntax highlighting.
- The only way to find syntax errors, was to compile, using
javac. - Most likely you found it slow, tedious, and inconvenient.
- The only way to find syntax errors, was to compile, using
Syntax highlighting a is pre-compile verification of source code, to verify it matches the language's grammar.
- On every code change: IDE runs a tokenizer and a parser
- Tokenized code elements are highlighted in colour.
- Constructs that cannot be parsed to a valid AST are highlighted as syntax errors.
- Text in red
- Red bar on right margin
- Exclamation mark on top right

See also: IntelliJ Jetbrains lexer and parser documentation.
Checkstyle
For syntax validation, linters usually do not build an AST and directly reason on the extracted token structure. Linters usually focus on enforcing visual coding conventions:
- Indentation
- Placement of parantheses
- Linebreaks
- Variable naming
- ...
An example is Checkstyle, which we've already seen in class. Checkstyle uses a configuration file to ensure all team members use the same visual code conventions. Why is this useful ?
- Code is easier to read if everyone uses the same convention.
- (A lot) fewer conflicts when working with a VCS, for example git.
Checkstyle IDE plugin
- Checkstyle is available as IDE plugin.
- For this course we use the google checkstyle coding convention as configuration file.
Full install description in course unit on IDEs.
Checkstyle maven plugin
- Checkstyle can be enforced as part of the build process
- When the green triangle is configured to invoke maven (
mvn clean package), this ensures your code will not compile / be launched unless there are no checkstyle violations. - The only changement needed is to activate the plugin in your project's
pom.xml:
<!-- Plugin to refuse build in case of checkstyle violations-->
<plugin>
    <groupId>org.apache.maven.plugins</groupId>
    <artifactId>maven-checkstyle-plugin</artifactId>
    <version>3.6.0</version>
    <configuration>
        <configLocation>google_checks.xml</configLocation>
        <consoleOutput>true</consoleOutput>
        <violationSeverity>warning</violationSeverity>
        <failOnViolation>true</failOnViolation>
        <failsOnError>true</failsOnError>
        <linkXRef>false</linkXRef>
    </configuration>
    <executions>
        <execution>
            <id>validate</id>
            <phase>validate</phase>
            <goals>
                <goal>check</goal>
            </goals>
        </execution>
    </executions>
</plugin>
That sounds inconvenient, why would I want that ?
While strict checkstyle rules may slow down code writing, they prevent poor code from execution and spreading. On the long run the absence of merge conflicts and constant developer productivity are more important than being able to hack code fast. A strict linter is tedious in the moment, but pays off on the long run.
Complexity
Often there are multiple ways to code the same functionality.
- In the best case, the behaviour of a complex solution is the same as of a simpler solution.
- But complex code is hard to understand, work with and maintain.
Ideally your code isYour code must not just be correct, but also as simple as possible.
Cyclomatic complexity
Cyclomatic complexity gives you a notion of how complex your code is, and provides you hints on how to simplify you code.
More concretely, to determine a cyclomatic complexity metric, we uses the AST to create a control flow graph representation of the program: * Control structures in the AST translate to graph nodes: function start & return, if, else, loops, code blocks. * Execution paths between control structures translate to graph edges.`
Based on the control flow graph properties, we compute a complexity metric, per method:

There's no dedicated maven plugin, but there's an IDE plugin for instant visual complextiy feedback, and checkstyle (for which there's a maven plugin) can be configured to assess cyclomatic complexity. ( Not covered in this course.)
Spotbugs
Spotbugs (formerly FindBugs) is an AST analyzer on steroids, that systematically searches your code for potential bugs, or even code constructs that often lead to bugs.
- Example: if you have a getter, returning a mutable object, FindBugs will let you know.
Spotbugs IDE plugin
Spotbugs is available as IDE plugin. After installation, you can access a new SpotBugs menu on the base bar, to scan your project, or a specific file for potential bugs.

Spotbugs maven plugin
Similar to javadoc and checkstyle, you can add spotbugs to your pom.xml configuration. Spotbugs will be invoked on
every mvn clean package.
<reporting>
    <plugins>
        <plugin>
            <groupId>com.github.spotbugs</groupId>
            <artifactId>spotbugs-maven-plugin</artifactId>
            <version>4.8.6.5</version>
        </plugin>
    </plugins>
</reporting>`
Info
Note that spotbugs will not block you from running your code, even if risky snippets are found. It only generates a test report.
PMD
For the really (really, really) brave. Check out PMD (Project Meets Deadline)
- It's actually not easy to write code where PMD has absolutely no complaints. (False positive alert !)
- But you can be sure your code improves a lot as you try (and you'll learn a lot)
PMD IDE plugin
PMD is available as IDE plugin. After installation, you can run the
static code analysis in Tools -> PMD -> Run predefined -> All
PMD maven plugin
Similar to javadoc, checkstyle and spotbugs, you can add PMD to your pom.xml configuration. PMD will be invoked on
every mvn clean package. To run only PMD, use: mvn clean pmd:check.
<!-- PMD static code analysis -->
<plugin>
    <groupId>org.apache.maven.plugins</groupId>
    <artifactId>maven-pmd-plugin</artifactId>
    <version>3.26.0</version>
    <configuration>
        <rulesets>
            <!-- full list: bestpractices, codestyle, design, documentation, errorprone, multithreading, performance-->
            <ruleset>/category/java/bestpractices.xml</ruleset>
        </rulesets>
        <!-- failOnViolation is actually true by default, but can be disabled -->
        <failOnViolation>true</failOnViolation>
        <!-- printFailingErrors is pretty useful -->
        <printFailingErrors>true</printFailingErrors>
        <linkXRef>false</linkXRef>
    </configuration>
    <executions>
        <execution>
            <goals>
                <goal>check</goal>
            </goals>
            <!-- Enforce the pmd:check goal is auto-executed during package phase-->
            <phase>package</phase>
        </execution>
    </executions>
</plugin>
The above configuration is the most basic, and only checks for codestyle. To unleash the full power of PMD, modify
the ruleset tag:
<ruleset>/category/java/bestpractices.xml</ruleset>
<ruleset>/category/java/codestyle.xml</ruleset>
<ruleset>/category/java/design.xml</ruleset>
<ruleset>/category/java/documentation.xml</ruleset>
<ruleset>/category/java/errorprone.xml</ruleset>
<ruleset>/category/java/multithreading.xml</ruleset>
<ruleset>/category/java/performance.xml</ruleset>
Literature
Inspiration and further reads for the curious minds:
- Stiévenart Quentin: INF889A
- Blogpost: What's a linter
- Moller & Schwartzbach: Static Program Analysis
- Jetbrains: Lexer and parser documentation.